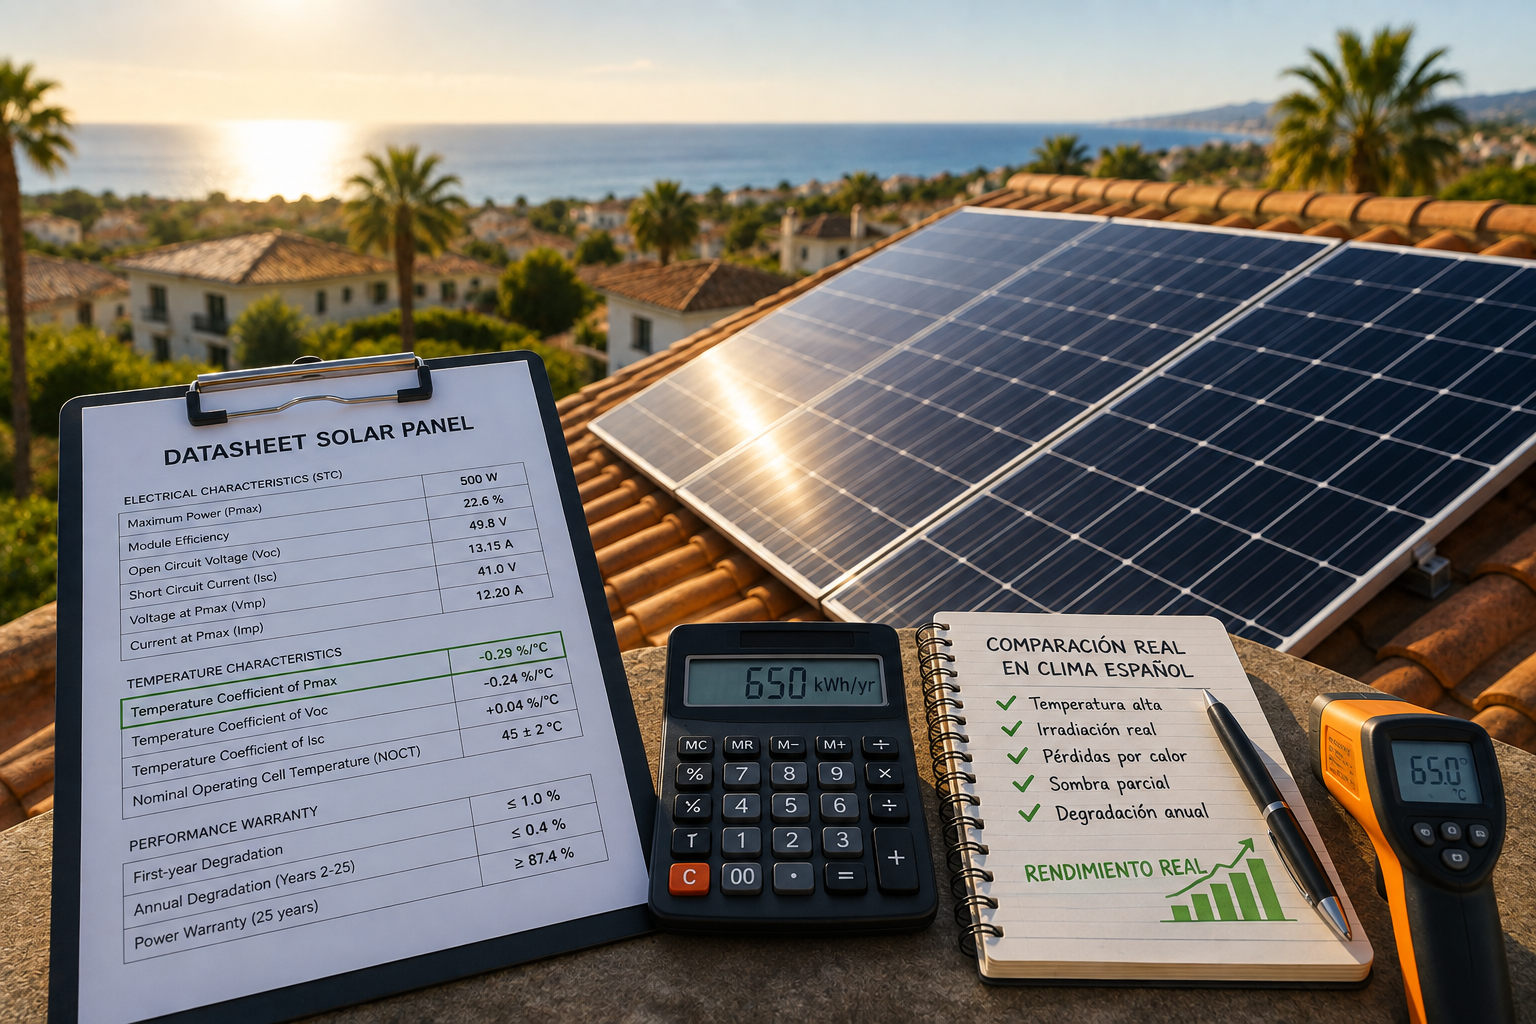
If you have been comparing quotes for solar panels for your home in Spain, you have probably seen datasheets full of numbers: 22.1% efficiency, temperature coefficient of -0.29%/°C, NOCT of 45°C, first-year degradation of 1%, PID resistance, and dozens of other specifications. Most homeowners look at the “efficiency” figure at the top of the datasheet and assume that is what matters. It is not.
The nominal efficiency figure that manufacturers highlight (typically 20 to 23 percent for modern panels) is measured under laboratory conditions that have almost nothing to do with what happens on your roof in Spain during a hot August afternoon. Two panels with identical “22% efficiency” ratings can perform 10 to 15 percent differently in real Spanish conditions over 25 years.
This guide explains how to actually read and compare solar panel efficiency ratings for the Spanish climate, which specifications really matter for your rooftop, and how to detect the tricks that some manufacturers use to make their panels look better than they are. At Solarea Tech we have installed more than 500 solar systems across the Alicante province, and we routinely see panels that look identical on paper deliver measurably different results in the field. Here is how to spot the differences before you buy.
Why “22% efficient panel” does not mean what you think it means
The nominal efficiency figure at the top of every solar panel datasheet is measured under Standard Test Conditions (STC). These conditions are:
- Solar irradiance: exactly 1,000 W/m²
- Cell temperature: exactly 25°C
- Air mass: 1.5 (equivalent to the sun at 41.8° above the horizon)
- Direct light, no diffuse
- Zero wind
These conditions were defined decades ago as an international standard for comparing panels. They are useful for that purpose. But they never happen on a real Spanish rooftop.
On a typical July day in Alicante, your roof might see:
- Solar irradiance: 900-1,050 W/m² (close to STC value)
- Cell temperature: 55-75°C (dramatically higher than STC’s 25°C)
- Combination of direct and diffuse light
- Real wind conditions varying throughout the day
The critical difference is temperature. A panel at 65°C produces significantly less than the same panel at 25°C. This is where the temperature coefficient becomes the most important number on the datasheet. More on this in a moment.
The 5 efficiency metrics on a datasheet (and which ones matter)
A modern solar panel datasheet contains at least five different “efficiency” or performance figures. Most homeowners only look at the first one. All five matter for a fair comparison.
Metric 1: Nominal module efficiency at STC
This is the headline number: “22.1% efficient” or “21.8% efficient”. It measures the percentage of solar energy converted into electricity at exactly 1000 W/m² and 25°C cell temperature.
Where to find it in the datasheet: usually in the main specifications table, listed as “Module Efficiency (%)” or “STC Efficiency”.
What it tells you: the theoretical maximum efficiency under controlled laboratory conditions.
What it does not tell you: anything about how the panel performs in Spanish summer heat, in partial shade, in low-light conditions, or over 25 years of degradation.
How to use it: as a rough first filter. Panels below 20 percent nominal efficiency are older generation. Panels at 21-22 percent are modern PERC standard. Panels at 22-24 percent are new generation TOPCon or HJT.
Metric 2: Nominal power at NOCT
NOCT (Nominal Operating Cell Temperature) is a more realistic test condition designed to reflect actual operating conditions. NOCT conditions are:
- Solar irradiance: 800 W/m²
- Ambient temperature: 20°C
- Wind speed: 1 m/s
- Cell temperature reached under these conditions: typically 42-48°C (varies by panel)
Where to find it in the datasheet: usually in the “Electrical Characteristics at NOCT” table.
What it tells you: how much power the panel actually produces under conditions closer to real world operation. NOCT power is always significantly lower than STC power (typically 74-78 percent of STC).
Why it matters: two panels with identical STC power can have different NOCT power. The panel with higher NOCT power will produce more in real conditions.
How to use it: calculate the ratio NOCT_power / STC_power for each panel you are comparing. Higher ratio = better real-world performance.
Example:
- Panel A: 500W STC, 375W NOCT → ratio 75%
- Panel B: 500W STC, 385W NOCT → ratio 77%
Both look identical on the STC headline, but Panel B produces about 2.7 percent more power in NOCT conditions.
Metric 3: Temperature coefficient of Pmax
The single most important metric for the Spanish climate. It tells you how much power the panel loses for each degree Celsius above 25°C.
Where to find it in the datasheet: in the “Temperature Characteristics” section, listed as “Temperature Coefficient of Pmax” with a value in %/°C.
Typical values by technology:
- PERC panels: -0.34 to -0.38 %/°C
- TOPCon panels: -0.28 to -0.32 %/°C
- HJT panels: -0.24 to -0.28 %/°C
Why it matters critically in Spain: roof temperatures in Alicante can reach 65-75°C during summer. That is 40-50°C above the STC test temperature.
Real calculation for Alicante summer:
Panel A with coefficient -0.35%/°C, roof temperature 65°C:
- Temperature difference: 65-25 = 40°C
- Power loss: 40 × 0.35 = 14%
- Effective power: 86% of rated
Panel B with coefficient -0.28%/°C, roof temperature 65°C:
- Temperature difference: 40°C
- Power loss: 40 × 0.28 = 11.2%
- Effective power: 88.8% of rated
The difference: Panel B produces about 3.3 percent more electricity during peak summer hours in Alicante conditions. Over the summer months (May to September), when your air conditioning is running the most, that adds up to significant extra kilowatt-hours.
How to use it: for hot Spanish climates (Costa Blanca, Murcia, Andalucía, Extremadura), always prefer panels with temperature coefficient better than -0.30%/°C. For cooler climates (northern Spain), the coefficient matters less.
Metric 4: First-year degradation and annual degradation
Solar panels lose a small amount of efficiency every year due to normal ageing. Two figures matter:
First-year degradation (Light Induced Degradation, LID):
- PERC panels: typically 2% in the first year
- TOPCon and HJT panels: typically 1% in the first year
Annual degradation (year 2 onwards):
- PERC panels: 0.50 to 0.55% per year
- TOPCon panels: 0.40 to 0.45% per year
- HJT panels: 0.25 to 0.30% per year
Where to find it in the datasheet: in the “Warranty” or “Performance Guarantee” section.
What it means over 25 years:
Panel with 2% first-year + 0.55% annual: produces 84.8% of original at year 25. Panel with 1% first-year + 0.40% annual: produces 89.4% of original at year 25. Panel with 1% first-year + 0.25% annual: produces 93.0% of original at year 25.
Real impact for a 5 kWp installation in Alicante:
Over 25 years, the panel with 0.55% degradation produces around 15,000 kWh less than the panel with 0.25% degradation. At current Spanish electricity prices (roughly 0.22 €/kWh), that is around 3,300 euros of extra value from choosing the better degradation profile.
How to use it: always check both the first-year degradation and the annual degradation rate. Lower is better. The performance warranty at year 25 (typically 84-92% depending on panel) is a direct consequence of the degradation rate.
Metric 5: Low-light performance
How well the panel produces electricity when solar irradiance is lower than STC (early morning, late afternoon, cloudy days, winter).
Where to find it in the datasheet: usually in the “Electrical Characteristics” tables, sometimes as a graph showing power output at 200 W/m², 400 W/m², 600 W/m², 800 W/m².
Why it matters in Spain: even in sunny Spain, panels operate at less than 1000 W/m² for most of the day. Morning and evening hours, cloudy days, and winter months mean irradiance is often 300-700 W/m². A panel with good low-light performance produces more during these hours.
How to compare: look for the “efficiency at 200 W/m²” or the low-light performance graph. Better panels maintain higher efficiency at lower irradiance levels.
How to compare two datasheets side-by-side (the practical process)
When you have two panel options and want to compare them properly for a Spanish installation, follow this 5-step process.
Step 1: Verify both are Tier 1
Only compare panels from Tier 1 manufacturers (JA Solar, LONGi, Canadian Solar, Jinko, Trina Solar, REC, Panasonic). Panels from unknown manufacturers cannot be compared meaningfully because their real-world performance is unpredictable regardless of what the datasheet claims.
Step 2: Compare the STC-headline
If Panel A is 20% efficient and Panel B is 22% efficient, they are in different generations. Prefer B unless there is a specific reason.
If both are 21-22% (same generation), the headline efficiency is not the deciding factor. Move to Step 3.
Step 3: Compare the temperature coefficient
Calculate the effective power at 65°C (typical Alicante summer roof temperature) for each panel:
Effective power = STC power × (1 + coefficient × 40)
Where coefficient is negative (e.g., -0.30%/°C means multiply by -0.30/100 = -0.003).
The panel with higher effective power at 65°C wins for the Spanish climate.
Step 4: Compare the degradation profiles
Calculate the performance at year 25:
Performance year 25 = (100% – first_year_degradation) × (1 – annual_degradation)^24
The panel with higher performance at year 25 wins over the long term.
Step 5: Compare warranties
Product warranty (covers manufacturing defects): higher is better. Modern Tier 1 panels offer 12 to 25 years.
Performance warranty (guarantees minimum output at year 25): higher percentage is better. Modern Tier 1 panels guarantee 84 to 92 percent at year 25.
Real-world comparison: two 500W panels for an Alicante home
To make this concrete, here is a real comparison of two panels that look almost identical at first glance.
Panel A (mid-range PERC from a Tier 1 manufacturer):
- STC power: 500W
- STC efficiency: 21.5%
- NOCT power: 374W (74.8%)
- Temperature coefficient: -0.35%/°C
- First-year degradation: 2%
- Annual degradation year 2+: 0.55%
- Performance year 25: 84.8%
- Product warranty: 12 years
- Performance warranty: 25 years at 84.8%
Panel B (mid-range TOPCon from a Tier 1 manufacturer):
- STC power: 500W
- STC efficiency: 22.5%
- NOCT power: 386W (77.2%)
- Temperature coefficient: -0.29%/°C
- First-year degradation: 1%
- Annual degradation year 2+: 0.40%
- Performance year 25: 89.4%
- Product warranty: 15 years
- Performance warranty: 25 years at 89.4%
Both look similar on the datasheet headline. Let us calculate the real difference.
At Alicante summer conditions (65°C roof temperature):
- Panel A effective power: 500 × (1 – 0.35/100 × 40) = 500 × 0.86 = 430W
- Panel B effective power: 500 × (1 – 0.29/100 × 40) = 500 × 0.884 = 442W
Panel B produces about 2.8 percent more power during summer peak hours.
Over 25 years for a 5 kWp installation (10 panels):
- Panel A total lifetime production: approximately 185,000 kWh
- Panel B total lifetime production: approximately 200,000 kWh
- Difference: 15,000 kWh, worth about 3,300 euros at current Spanish prices.
If Panel B costs 500 euros more upfront:
- Extra cost: 500 euros
- Extra lifetime value: 3,300 euros
- Net gain from choosing Panel B: 2,800 euros over 25 years
This is how you actually compare panels beyond the headline number.
Common tricks in solar panel datasheets to watch for
Some manufacturers use presentation tactics to make their panels look better than they are. Here are the most common ones.
Trick 1: Only showing STC performance, hiding NOCT
Some datasheets only prominently display STC values and bury the NOCT (or omit them entirely). Since STC is unrealistic for real conditions, this hides real-world performance.
How to counter: always ask for the NOCT performance data. If the manufacturer or vendor cannot provide it, be cautious.
Trick 2: Emphasising Voc/Isc instead of Pmax
Voc (open circuit voltage) and Isc (short circuit current) are secondary parameters. The critical parameter is Pmax (maximum power output). Some datasheets emphasise Voc and Isc improvements to distract from mediocre Pmax performance.
How to counter: focus your comparison on Pmax values at both STC and NOCT.
Trick 3: Comparing to older-generation reference panels
Some marketing materials compare “our new panel” against outdated reference panels to show impressive percentage improvements (“30% more efficient than conventional panels!”). This is technically true but meaningless if the “conventional panel” is a 10-year-old technology.
How to counter: ask what specific reference panels are being compared, and verify they are current-generation options you would actually consider.
Trick 4: Emphasising a single climate scenario
Some datasheets or marketing materials emphasise performance in specific conditions (e.g., “outperforms competitors in low-light conditions by 15%”) that may not apply to your Spanish rooftop.
How to counter: focus on the metrics that matter for your specific climate (temperature coefficient for hot climates, low-light performance for cloudy regions).
Trick 5: Warranty terms that sound better than they are
“25-year performance warranty” sounds good, but the question is: at what percentage? A warranty guaranteeing 80% at year 25 is much weaker than one guaranteeing 92%.
How to counter: always read the exact warranty terms. What percentage is guaranteed at year 10, year 15, year 25? What is the annual degradation cap?
Trick 6: Comparing published efficiency to competitors’ unpublished figures
Sometimes marketing materials show your product’s efficiency prominently while omitting or misrepresenting competitors’ figures.
How to counter: always obtain the actual datasheets from each manufacturer. Compare like-for-like using the same specifications.
Which metrics matter most for different regions of Spain
The importance of specific metrics changes based on climate zone.
Costa Blanca and Mediterranean coast (Alicante, Valencia, Murcia)
Most important metrics:
- Temperature coefficient (critical due to extreme summer temperatures)
- NOCT performance (realistic conditions closer to your actual roof)
- Salt mist certification IEC 61701 (if within 1-2 km of the coast)
- Low-light performance (less critical, plenty of direct sun)
Southern Spain interior (Seville, Córdoba, Extremadura)
Most important metrics:
- Temperature coefficient (extreme summer temperatures, roof temperatures can exceed 75°C)
- NOCT performance
- Annual degradation rate (long lifespan justifies premium panels)
Central Spain (Madrid, Castilla-La Mancha)
Most important metrics:
- Temperature coefficient (hot summers)
- Cold weather resistance (some winter days below freezing)
- Cyclic thermal stress resistance (large temperature swings)
- NOCT performance
Northern Spain (Galicia, Asturias, Basque Country, Cantabria)
Most important metrics:
- Low-light performance (more cloudy days)
- Cold weather resistance
- Water ingress resistance (more humidity and rain)
- Temperature coefficient less critical
Canary Islands
Most important metrics:
- Temperature coefficient (year-round warm temperatures)
- Salt mist certification IEC 61701 (coastal environment)
- UV resistance (high solar irradiance year-round)
What we look at when we compare panels at Solarea Tech
After more than 500 installations, here is the framework we actually use internally when comparing panel options for a specific client.
First filter: Tier 1 status verified. Only Tier 1 manufacturers (JA Solar, LONGi, Canadian Solar, Jinko, Trina Solar, REC, Panasonic) are considered for residential installations.
Second filter: appropriate technology for the case. PERC for standard cases, TOPCon for hot climates or space-constrained roofs, HJT for premium projects.
Third filter: real performance in Alicante conditions. We calculate the effective power at 65°C roof temperature (typical summer peak) using the temperature coefficient. This eliminates panels that look good at STC but disappoint in real conditions.
Fourth filter: degradation profile. We calculate lifetime production over 25 years using the first-year and annual degradation rates. This identifies panels that maintain more of their initial performance long-term.
Fifth filter: warranty terms. We verify both product warranty and performance warranty terms are enforceable through European channels. Verify the manufacturer will still exist to honour the warranty in 15-20 years.
Sixth filter: specific certifications for the case. IEC 61701 salt mist certification for coastal properties. IEC 61215 for standard performance. UL certifications if applicable.
Seventh filter: value for money. Only after passing all technical filters, we compare the price per watt to select the option with best value.
This is what a proper professional comparison looks like. Anyone selling you panels without going through this process is either not really an expert, or is treating you as a price-only customer.
For a detailed comparison of the main panel brands we work with, see our guide on what are the best solar panel brands for residential use.
Frequently asked questions
What is the most important solar panel efficiency metric for Spain?
For hot Spanish climates (Costa Blanca, Andalucía, central Spain), the temperature coefficient of Pmax is the most important metric after the basic nominal efficiency. Because roof temperatures in Spain often exceed 60°C during summer, panels with better temperature coefficients (closer to zero, e.g., -0.25%/°C vs -0.35%/°C) produce meaningfully more electricity during peak summer months.
Why do panels with the same STC efficiency produce different amounts of electricity?
The STC (Standard Test Conditions) efficiency is measured under laboratory conditions that do not represent real-world Spanish rooftops. Two panels with identical 22% STC efficiency can differ in temperature coefficient, degradation rate, low-light performance, and NOCT power, all of which affect real-world production. Over 25 years, these differences can accumulate to 10-15 percent in total lifetime energy production.
What is NOCT and why does it matter?
NOCT (Nominal Operating Cell Temperature) is a more realistic test condition than STC. It uses 800 W/m² irradiance, 20°C ambient temperature, and 1 m/s wind, resulting in cell temperatures of 42-48°C (much closer to real operating conditions). NOCT power is typically 74-78% of STC power. Comparing NOCT/STC ratios between panels tells you which one performs better in realistic conditions.
Is a 22% efficient panel really better than a 20% efficient panel?
Not necessarily in real-world Spanish conditions. A 20% efficient panel with excellent temperature coefficient and slow degradation can outperform a 22% efficient panel with poor temperature performance over 25 years. Also, higher efficiency matters more when roof space is limited. When space is abundant, the lower-efficiency panel at a lower price often gives better value per euro invested.
How much does temperature affect solar panel output in Spain?
Significantly. In Alicante summer conditions, roof temperatures can reach 65-75°C, which is 40-50°C above the STC test temperature of 25°C. A panel with temperature coefficient of -0.35%/°C loses about 14-17 percent of its power during peak summer hours. A panel with coefficient -0.25%/°C loses about 10-12.5 percent. This is 3-5 percent of extra electricity from better temperature performance during the highest-demand months.
Do I need certified salt-mist-resistant panels near the coast in Spain?
Yes. Any installation within 1-2 km of the Mediterranean coast (Torrevieja, Orihuela Costa, Altea, Calpe, Denia, Jávea, Moraira, and similar locations) should use panels with IEC 61701 salt mist certification. Without this certification, salt film buildup and frame corrosion can cause premature degradation, losing 15-25 percent of production within 5 years.
What is a good annual degradation rate for solar panels?
Modern Tier 1 panels have annual degradation rates of 0.25 to 0.55 percent per year after the first year. HJT panels typically have the best degradation profile (0.25-0.30%), followed by TOPCon (0.40-0.45%), then PERC (0.50-0.55%). Over 25 years, the difference between the best and worst degradation profile translates to 4-6 percent more lifetime production for the slower-degrading panel.
Should I trust the efficiency numbers from lesser-known manufacturers?
No, be cautious. Efficiency ratings from Tier 1 manufacturers are independently verified and enforceable through warranty. Unknown or Tier 3 manufacturers may publish inflated numbers that do not correspond to real production, and their warranties often cannot be enforced if performance is below claimed levels.
How can I verify a solar panel’s real-world performance before installing?
Ask your installer for real-world performance data from previous installations of the same panel model. Reputable installers keep production data from their monitoring systems and can share aggregate performance vs manufacturer specifications. At Solarea Tech, we can share this data for the panels we install (JA Solar and LONGi as our primary suppliers).
What is PID and should I worry about it?
PID (Potential Induced Degradation) is a phenomenon where high voltage between the panel and the ground can cause accelerated efficiency loss over time. It was a significant issue with older panels but modern Tier 1 panels are all PID-resistant. Verify PID resistance is mentioned in the datasheet, especially for installations in humid or coastal environments.
Get expert analysis of the best panels for your Spanish home
Reading solar panel datasheets correctly requires technical knowledge that most homeowners understandably do not have. Different panel models are better for different specific cases, and the right choice depends on your roof, climate zone, budget, and long-term goals.
If you would like an expert comparison of panel options for your specific case, we would be happy to help. Our free, no-obligation assessment includes:
Analysis of your recent electricity bills. Site visit and roof assessment (structure, orientation, shading, thermal conditions). Solar production simulation for your exact location using real climate data. Comparison of 2-3 panel options with real-world performance calculations for your specific conditions. Complete quote with itemised transparent pricing. All applicable subsidies and tax deductions calculated. Remote coordination if you are not based in Spain full time.
👉 Request your free assessment in English and we will get back to you within 24 hours.